Bitcoin Price Predictions — What to expect by 30-Sep-2025
As of 1 Sep 2025 Bitcoin is trading around $108k. Over the next month (to 30 Sep 2025) the market will likely follow one of three realistic paths (bear / base / bull). Below I give concrete price ranges, probabilities, the logic behind each scenario, and the main catalysts you should watch. This is analysis and not financial advice. Use position sizing, stop-losses, and do your own research.
Quick context — why the market cares right now
- Spot Bitcoin ETFs are now mainstream. The SEC approved spot-Bitcoin ETPs in January 2024, and those products changed how capital flows into BTC (greater retail & institutional access). That structural change still matters for price formation and volatility in 2025.
- Supply pressure from the 2024 halving. The most recent halving occurred in April 2024 (reducing miner issuance). Less new supply entering markets can support higher prices over time, especially if demand remains strong.
- Macro policy dominates short-term moves. Fed policy, inflation prints, and risk-asset flows are driving short-term BTC swings in 2025 — a dovish Fed tends to help BTC; hawkish surprises can trigger sharp retracements. Recent commentary from Fed officials and Jackson Hole speeches has been influential.
The three scenarios (concrete targets for 30-Sep-2025)
Each scenario includes a probability estimate (subjective), a price range for 30-Sep-2025, the core drivers, and what would invalidate it.
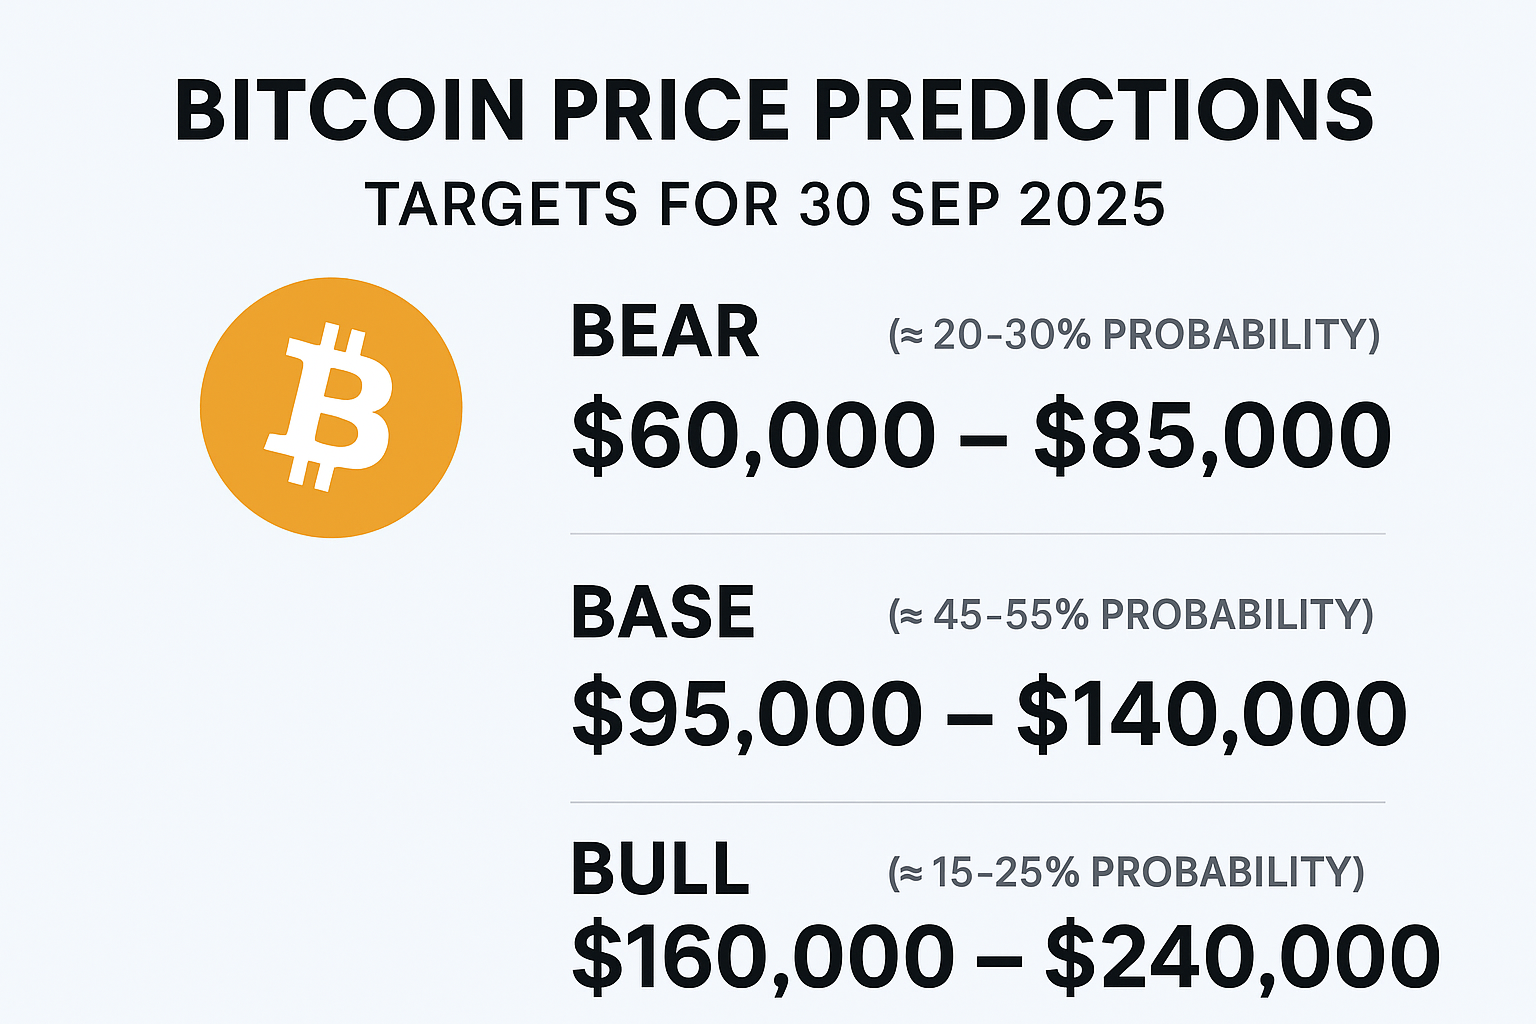
1) Bear scenario — $60,000 – $85,000 (≈ 20–30% probability)
Why: A surprise macro shock (stronger-than-expected inflation, hawkish Fed, major liquidity event, or a political/legal shock that reduces institutional appetite) triggers ETF outflows and forced deleveraging. Technical breakdown below $95k accelerates selling into the $70k area.
Catalysts to watch: surprising hawkish Fed language or data, big net ETF outflows, major exchange/credit event.
Invalidation: sustained net ETF inflows and improved risk sentiment for the whole month.
(ETF flows/noise around approvals and trading have been a material factor since 2024 — watch flow data).
2) Base (most-likely) scenario — $95,000 – $140,000 (≈ 45–55% probability)
Why: Market consolidates after a summer rally. Macro prints are mixed, but the Fed edges toward a gradual, predictable path (no shock). ETF-related demand continues but not explosively; crypto-specific on-chain signals show neutral-to-mild accumulation. Psychologically, ~$100k acts as support, while $120–140k becomes a target zone if inflows pick up.
Catalysts to watch: steady or modestly positive ETF flows, neutral Fed tone, continued institutional allocation into ETFs and derivatives.
Invalidation: sudden large ETF inflows or major adoptions that push price quickly above $160k (moves us into bull); or big macro shock downward (pushes us to bear).
3) Bull scenario — $160,000 – $240,000+ (≈ 15–25% probability)
Why: Renewed institutional FOMO, a wave of new ETF inflows or a dovish swing in U.S. policy (big cut expectations) weakens the dollar and pushes risk appetites higher. Technical breakouts plus concentrated buying into ETFs could create a rapid re-rating. The halving supply squeeze amplifies upside when demand spikes.
Catalysts to watch: large, persistent ETF inflows; major corporates or sovereigns announcing direct allocations; dovish Fed decision/communication.
Probability-weighted take (simple estimate)
If we combine the scenarios: base outcome is most likely. A reasonable single-number median target for 30-Sep-2025 (with wide uncertainty) sits around $110k–$130k — i.e., roughly around the current level or a modest gain by month-end — but volatility can swing price into the bear or bull bands above. (Remember: short-term crypto predictions have high error margins; treat this as scenario planning, not a promise.)
(Why median ~110–130k? Current price ~108k and near-term macro & ETF flows are the dominant inputs; absent a big shock, modest drift ±20% is plausible in 30 days.)
What to watch this month — the 6 highest-impact indicators
- ETF flows (net inflows/outflows) — daily/weekly net flows are immediate liquidity signals. Chainalysis and exchange flow trackers are useful for real-time reads.
- US macro prints (CPI/PCE, employment) — drive Fed expectations and the dollar. Dovish surprises often help BTC; hawkish ones hurt.
- Fed commentary & policy risk — speeches and any political pressure on Fed independence add volatility (watch news flow).
- On-chain accumulation metrics — long-term holder accumulation vs. exchange reserves; rising exchange reserves can signal sell pressure. (On-chain dashboards are helpful.)
- Derivatives (futures basis, open interest, funding rates) — extremes here often precede volatility spikes.
- Macro risk events / Geopolitics — risk-off shocks (bank, sovereign, or geopolitical) can shift assets quickly.
Technical levels to monitor (short-term)
- Support: ~$95–100k (psychological + recent consolidation band)
- Near resistance: ~$120k–140k (prior swing highs / round numbers)
- Bull breakout level: sustained close above $150–160k could open the path to $200k+ in momentum-driven moves.
(Technical levels are approximate and should be combined with flow/macro context.)
Risks & caveats (be honest)
- This is short-term forecasting (30 days) — noise and randomness are large. Short-term BTC forecasts have particularly wide error bars.
- Market microstructure matters. ETF creations/redemptions, OTC block trades, and derivatives liquidations can cause outsized one-day moves.
- Political and regulatory shocks remain tail risks; market sentiment can flip fast.
Quick checklist for traders & investors (practical)
- If you trade: use clear stop rules, size positions small relative to capital, and watch ETF flow dashboards and the macro calendar.
- If you invest long-term: don’t overreact to 30-day moves; use dollar-cost averaging if adding exposure.
- If you want alerts: monitor net ETF flow reports, Fed minutes/speeches, and major macro prints.
Sources & further reading (key references used)
- Live price & recent history snapshots: YCharts / Yahoo Finance / CoinMarketCap (price as of 1 Sep 2025 ≈ $107–108k).
- SEC statement on spot-Bitcoin ETP approvals (Jan 10, 2024) — structural change to market.
- Chainalysis explainer on spot Bitcoin ETFs and market impacts.
- Coverage of the April 2024 halving and its market implications.
- Recent Fed & macro commentary affecting crypto (Aug 2025 coverage)
Short FAQ
Q: Will Bitcoin be above $100k on 30-Sep-2025?
A: Base case probability >50% that BTC remains around or above $95–100k by month-end, but short-term shocks could push it below. See scenarios above.
Q: What’s the single biggest short-term driver?
A: ETF flows and US Fed/macro signals — together they set risk appetite and liquidity for BTC.
Q: Is the 2024 halving still relevant?
A: Yes — lower new issuance is a structural factor that amplifies price moves if demand increases. But halving is not an on/off switch for price.
Final words
Short-term forecasting is noisy: expect volatility. My best, honest read for 30-Sep-2025 is a base case around $110k–$130k, with credible bear and bull tails stretching roughly to $60k and $240k, respectively. Keep a close eye on ETF flows and the macro calendar this month — they’ll likely decide which path plays out.