BNB Price Prediction 2026-2031 | Analyst Forecast
BNB Price Prediction (2026-2031): Analyst Consensus, Scenarios & Key Drivers
Binance Coin (BNB) remains one of the most closely watched assets in the crypto market due to its deep integration with the Binance ecosystem and the BNB Chain. To provide a clearer long-term outlook, we analyzed BNB price predictions from multiple analysts, AI models, and crypto platforms, focusing on the period from 2026 to 2031.
These forecasts combine historical price cycles, technical indicators, macro trends, and AI-based modeling, though it’s important to note that prediction methodologies vary across platforms.
Analyst Consensus: BNB Price Forecast (2026–2031)
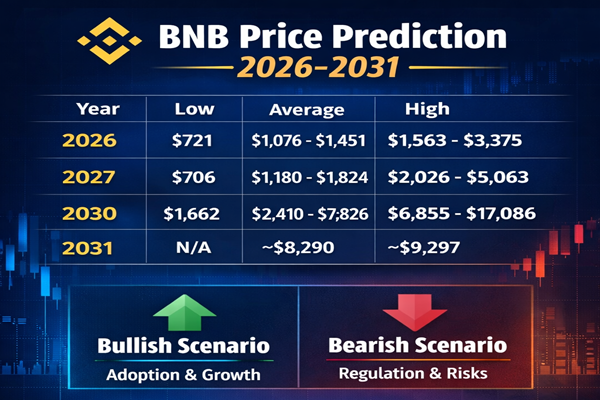
The table below summarizes low, average, and high BNB price estimates based on aggregated analyst data.
| Year | Low Price | Average Price | High Price | Key Analyst Sources |
|---|---|---|---|---|
| 2026 | $721.99 | $1,076 – $1,451 | $1,563 – $3,375 | CoinCodex, Standard Chartered, Axi |
| 2027 | $705.90 | $1,180 – $1,824 | $2,026 – $5,063 | Coinpedia, MEXC, 3Commas |
| 2030 | $1,662 | $2,410 – $7,826 | $6,855 – $17,086 | Digital Coin Price, Coinpedia, Hexn.io |
| 2031 | N/A | ~$8,290 | ~$9,297 | MEXC |
Key takeaway:
Most long-term forecasts suggest BNB could outperform the broader market in the next major bull cycle, especially if ecosystem growth and token burns continue as planned.
Bullish vs Bearish BNB Price Scenarios for 2026
To provide a more realistic outlook, analysts often model two primary scenarios:
- Bullish Scenario: Strong crypto adoption, positive regulation, and ecosystem expansion
- Bearish Scenario: Regulatory pressure, market corrections, or weak investor sentiment
Monthly BNB Price Forecast (2026)
| Month | Bullish Scenario (High) | Bearish Scenario (Low) | Key Market Drivers |
|---|---|---|---|
| Jan | $960 – $1,120 | $610 – $670 | New-year momentum vs post-holiday correction |
| Feb | ~$1,130 | $720 – $760 | Resistance breakout or support retest |
| Mar | ~$1,335 | $790 – $810 | End of Q1 volatility |
| Apr | $1,416 – $1,424 | ~$780 | Ecosystem updates and growth news |
| May | ~$1,500 | $764 – $900 | Mid-year trend confirmation |
| Jun | ~$1,516 | $759 – $947 | Half-year performance review |
| Jul | $1,035 – $1,080 | ~$755 | Typically low summer volatility |
| Aug | $1,089 – $1,424 | ~$764 | Anticipation of token burn events |
| Sep | ~$1,146 | ~$744 | End-of-Q3 positioning |
| Oct | ~$1,206 | ~$732 | “Uptober” trend vs sell-off risk |
| Nov | ~$1,269 | ~$723 | Pre-holiday trading behavior |
| Dec | $1,335 – $1,563 | $721 – $748 | Year-end consolidation & tax selling |
Key Factors Influencing BNB Price Predictions
BNB’s valuation is shaped by a mix of tokenomics, ecosystem growth, and regulatory developments.
Bullish Drivers Supporting BNB
1. Deflationary Tokenomics
BNB has a fixed maximum supply of 200 million tokens, with an automated burn mechanism designed to reduce supply to 100 million BNB over time. This creates long-term scarcity.
2. Expanding Ecosystem Utility
BNB is the backbone of BNB Chain, powering DeFi, NFTs, GameFi, and real-world asset tokenization. It is also widely used for trading fee discounts on Binance, sustaining real demand.
3. Reduced Regulatory Uncertainty
The $4.3 billion settlement in 2024 between Binance and the U.S. Department of Justice removed a major overhang that had weighed on investor confidence, although regulatory monitoring continues.
Bearish Risks to Watch
1. Regulatory Dependence on Binance
BNB’s performance remains closely tied to Binance’s global regulatory standing. Any new enforcement actions or restrictions could negatively affect price.
2. High Market Correlation
BNB historically follows Bitcoin-led market cycles. A prolonged BTC bear market could drag BNB lower regardless of fundamentals.
3. Centralization Concerns
BNB Chain’s Proof of Staked Authority (PoSA) consensus model relies on a limited validator set, which some investors view as a centralization risk.
Investment Strategies: Short-Term vs Long-Term BNB Holders
Your approach to BNB should align with your time horizon and risk tolerance.
Short-Term Traders
- Rely on technical analysis, momentum indicators, and sentiment tools
- Trade within clearly defined support and resistance zones
- Monitor quarterly and annual BNB burn events
- Use tight stop-losses due to volatility
Long-Term Investors
- Focus on fundamentals, not daily price movements
- Track TVL, active addresses, ecosystem growth, and supply reduction
- Use dollar-cost averaging (DCA) to manage entry risk
- Be prepared for multi-year holding periods
How Crypto Prediction Websites Work (Including Coin-Predictions.com)
Crypto prediction platforms such as CoinCodex, Coinpedia, Digital Coin Price, and Coin-Predictions.com typically use a mix of:
- Historical price data
- Technical indicators
- Market cycle analysis
- AI-based forecasting models
While these tools provide valuable directional insights, methodologies are often not fully transparent and should be used as guidance rather than financial advice.
At Coin-Predictions.com, forecasts are best used alongside your own research, risk management, and broader market awareness.
Frequently Asked Questions (FAQs) – BNB Price Prediction
1. What is the BNB price prediction for 2026?
Based on aggregated analyst forecasts and AI models, BNB could trade between $721 and $1,563 in 2026, with an average price range of $1,076 to $1,451 under normal market conditions. Strong adoption and bullish sentiment could push prices higher.
2. Can BNB reach $2,000 by 2027?
Yes, several analysts believe BNB could cross $2,000 in 2027 if the crypto market enters a sustained bull cycle and BNB Chain continues to expand in DeFi and real-world asset tokenization.
3. Is Binance Coin (BNB) a good long-term investment?
BNB is often considered a strong long-term crypto asset due to its deflationary tokenomics, regular token burns, and deep utility within the Binance ecosystem. However, long-term performance still depends on market cycles and regulation.
4. What factors influence BNB price predictions the most?
The most important factors affecting BNB price forecasts include Binance regulatory developments, BNB token burn events, overall crypto market sentiment, Bitcoin price trends, and BNB Chain ecosystem growth.
5. How high can BNB go by 2030?
According to long-term predictions, BNB could reach between $6,800 and $17,000 by 2030 in a highly bullish scenario. Average estimates suggest a more conservative range between $2,400 and $7,800.
6. Can BNB price fall below $700 again?
In a strong bearish market or under negative regulatory news, BNB could revisit levels near $700, especially if Bitcoin experiences a prolonged downturn. Market correlation remains a key risk.
7. How accurate are BNB price predictions?
BNB price predictions are estimates, not guarantees. They are generated using historical data, technical indicators, and AI models, but sudden market events can significantly change price direction.
8. Does BNB token burn increase its price?
BNB token burns reduce circulating supply, which can support price growth over time. While burns don’t cause instant price spikes, they contribute to long-term scarcity and value appreciation.
9. Is BNB better for short-term trading or long-term holding?
BNB suits both strategies. Short-term traders focus on volatility and technical levels, while long-term investors benefit from ecosystem growth, supply reduction, and multi-year holding strategies.
10. Where can I find reliable BNB price predictions?
You can find updated BNB price predictions, technical analysis, and market forecasts on trusted crypto platforms and research-based sites like Coin-Predictions.com, which combine AI models with market data.