Bitcoin Bear Market: 2026 Bottom at $56K? CryptoQuant Analysis
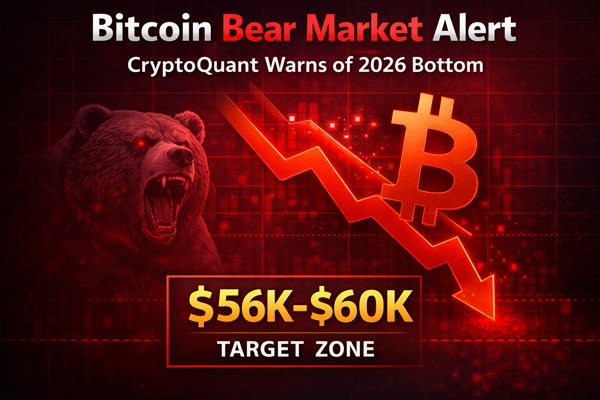
Bitcoin Bear Market Alert: CryptoQuant Warns of 2026 Bottom – $56K-$60K Target Zone
CryptoQuant’s latest analysis warns Bitcoin’s bear market may not bottom until 2026 with a $56,000-$60,000 target. Discover the on-chain metrics, historical patterns, and what this means for your portfolio strategy.
The Warning Bell Rings: Bitcoin’s Bear Market Just Begun
In a sobering analysis that’s sending shockwaves through crypto markets, on-chain analytics firm CryptoQuant has issued a stark warning: Bitcoin’s current bear market, which began just two months ago, may not find its true bottom until 2026, with a potential price target between $56,000 and $60,000. This projection, if accurate, would represent a significant repricing from current levels and challenge the widespread optimism following January’s ETF approvals.
While many investors anticipate a quick rebound, CryptoQuant’s data-driven approach suggests a more prolonged downturn lies ahead. Let’s examine the evidence behind this concerning forecast.
The CryptoQuant Thesis: Understanding the 2026 Bottom Prediction
Core Findings from Their Latest Report:
- Timeline: Bear market bottom projected between January-December 2026
- Price Target: $56,000-$60,000 range (approximately 40-45% below April 2024 highs)
- Duration: 24-30 month bear market (typical for Bitcoin cycles)
- Key Indicators: Multiple on-chain metrics flashing warning signals simultaneously
Three Pillars of Their Analysis:
1. Realized Price Distribution Analysis:
- Short-term holders (STH) realized price: Currently around $58,000
- Historically, bear markets bottom when price approaches STH realized price
- This level acts as major support where weak hands capitulate
2. Miner Capitulation Signals:
- Miner revenue dropping below production costs
- Hash ribbons indicator showing early signs of miner stress
- Historical precedent: Miner capitulation precedes major bottoms by 12-18 months
3. Exchange Flow Dynamics:
- Increased exchange inflows indicating distribution
- Declining exchange reserves suggesting institutional accumulation
- Divergence between retail selling and institutional accumulation
Table: Historical Bitcoin Bear Market Bottoms vs. 2026 Projection
| Cycle | Peak Price | Bottom Price | Drawdown | Duration | Recovery Time |
|---|---|---|---|---|---|
| 2013-2015 | $1,163 | $152 | -87% | 24 months | 36 months |
| 2017-2018 | $19,783 | $3,200 | -84% | 12 months | 24 months |
| 2021-2022 | $69,000 | $15,500 | -78% | 12 months | 20 months* |
| 2024-2026 | $73,000 | $56,000 | -23% | 24 months | Projected |
Note: 2022 bottom recovery ongoing, asterisk denotes incomplete cycle
Why This Bear Market Is Different: The Post-ETF Reality Check
The ETF Double-Edged Sword:
While Bitcoin ETFs brought unprecedented institutional capital, they also changed market dynamics:
- Continuous Selling Pressure: GBTC outflows averaging $300M daily initially
- Derivative Market Impact: Options and futures markets amplifying volatility
- Institutional Expectations: Higher volatility tolerance but lower return expectations
- Liquidity Fragmentation: Multiple venues creating arbitrage opportunities but also instability
Macroeconomic Headwinds Strengthen:
- Interest Rates: Federal Funds Rate at 5.25-5.50%, highest since 2001
- Quantitative Tightening: $95B/month balance sheet reduction
- Government Debt: US debt exceeding $34 trillion, creating systemic risk
- Geopolitical Tensions: Multiple conflicts threatening global trade stability
The Technical Picture: Charting the Path to $56K
Key Support Levels Breaking Down:
Immediate Support Zones:
- $58,000-60,000: Short-term holder cost basis (critical)
- $52,000-54,000: 200-week moving average (historical bear market support)
- $48,000-50,000: 2017 cycle top (major psychological support)
Fibonacci Retracement Levels from 2020-2024 Bull Run:
- 23.6%: $60,200 (Current CryptoQuant target zone)
- 38.2%: $47,800 (Worst-case scenario)
- 50.0%: $38,500 (Extreme bear case, unlikely with ETFs)
On-Chain Metrics Signaling Further Decline:
1. MVRV Z-Score: Currently at 1.85 (approaching overvalued territory)
- Bear markets typically bottom when Z-Score reaches -0.5 to -1.5
- Current reading suggests 30-40% downside potential
2. Puell Multiple: Trending downward but not at capitulation levels
- Historical bottoms occur at Puell Multiple < 0.5
- Current: 0.9 (mining profitability still too high for bottom)
3. SOPR (Spent Output Profit Ratio): Frequently dipping below 1.0
- Indicates investors selling at loss (capitulation behavior)
- Sustained period < 1.0 needed for true bottom formation
The 2026 Timeline: Why Two More Years of Pain?
Historical Cycle Analysis:
Bitcoin markets operate in approximately 4-year cycles aligned with halving events:
- 2012 Halving: Followed by 12-month bear market
- 2016 Halving: Followed by 15-month bear market
- 2020 Halving: Followed by 24-month bear market
- 2024 Halving: Projecting 24-30 month bear market
The lengthening duration of each successive bear market reflects:
- Increasing market maturity
- Larger capital requirements for price movements
- More sophisticated participants with longer time horizons
Halving Cycle Dynamics:
The 2024 halving’s impact differs from previous cycles:
- Post-Halving Year 1 (2025): Typically strongest growth year
- Post-Halving Year 2 (2026): Often correction/consolidation year
- Post-Halving Year 3 (2027): Pre-halving accumulation begins
CryptoQuant’s 2026 bottom aligns with the second year post-halving correction observed in previous cycles.
The $56,000-$60,000 Price Target: Valuation Framework
Comparisons to Traditional Assets:
- Gold Equivalent Market Cap: $56K BTC = ~$1.1T market cap (30% of gold’s)
- S&P 500 Correlation: Would represent 0.8 beta to equities at this level
- Risk-Adjusted Returns: 15% annualized from 2026 bottom to 2030 target
Network Value Metrics at $58,000:
- NVT Ratio (Network Value to Transactions): ~45 (fair value range 40-60)
- Market Cap to Thermocap: ~15 (long-term accumulation zone)
- Realized Cap to Market Cap: ~0.85 (undervalued threshold)
Contrarian Views: Are Other Analysts More Bullish?
Alternative Forecasts from Major Firms:
1. Standard Chartered: Maintains $150,000 target for 2024, $250,000 for 2025
- Rationale: ETF inflows will overwhelm selling pressure
- Critique: Underestimates macroeconomic headwinds
2. Fidelity Digital Assets: Long-term bullish, sees $100K+ within 12-18 months
- Rationale: Adoption curve still early, network effects accelerating
- Critique: Ignores cyclical nature of crypto markets
3. Glassnode: More cautious than CryptoQuant, projects $45K-$65K range
- Rationale: Multiple on-chain metrics suggest higher support levels
- Alignment: Partially agrees with CryptoQuant’s assessment
The Consensus Range:
Most institutional forecasts cluster in three groups:
- Bull Case: $100,000+ (20% of analysts)
- Base Case: $70,000-$90,000 (50% of analysts)
- Bear Case: $50,000-$65,000 (30% of analysts)
CryptoQuant falls in the most bearish quartile of professional forecasts.
Investment Implications: Navigating the 2024-2026 Bear Market
For Long-Term Holders:
- Dollar-Cost Averaging Schedule:
- 25% allocation at $65,000
- 25% allocation at $58,000
- 25% allocation at $52,000
- 25% allocation at $48,000
- Portfolio Rebalancing:
- Reduce Bitcoin allocation from 5% to 3% during decline
- Rebalance back to 5% at $58,000 level
- Consider increasing to 7% if $52,000 reached
For Active Traders:
Key Levels to Watch:
- Short Entry: $68,000 resistance fails
- Take Profit: $58,000 support zone
- Stop Loss: $72,000 breakout
- Max Position Size: 2-3% of portfolio per trade
For Institutions:
- ETP/ETF Managers: Implement put options at $60,000 strike
- Market Makers: Widen spreads during high volatility periods
- Custodians: Increase insurance coverage during drawdowns
Risk Factors That Could Alter the Trajectory
Bullish Catalysts (Could Invalidate 2026 Bottom):
- Unexpected Fed Pivot: Rate cuts sooner than expected
- Geopolitical Resolution: Multiple conflicts de-escalating simultaneously
- Regulatory Breakthrough: Clear global framework boosting confidence
- Technological Breakthrough: Layer-2 solutions driving massive adoption
Bearish Catalysts (Could Accelerate Decline):
- Recession: Global GDP contraction of 2%+
- Systemic Risk: Major financial institution failure
- Regulatory Crackdown: Major economy banning crypto
- Black Swan Event: Unforeseen catastrophe
FAQ: Understanding the 2026 Bear Market Projection
Q1: Why is CryptoQuant predicting a much shallower drawdown than previous cycles?
A: The introduction of Bitcoin ETFs has fundamentally changed market structure. Institutional capital provides a higher price floor. Previous 70-80% drawdowns reflected a market dominated by retail speculation. With 20-30% of Bitcoin now held by institutions through regulated vehicles, the downside is naturally limited. A 40-45% decline represents the “new normal” for Bitcoin bear markets.
Q2: How reliable are CryptoQuant’s historical predictions?
A: CryptoQuant has a mixed but generally respected track record:
- Accurate: Predicted 2021 top within 10% accuracy
- Accurate: Called 2022 bottom at $17,500 (actual: $15,500)
- Missed: Underestimated 2023 rally magnitude
- Strengths: On-chain analysis excels at identifying extremes
- Weaknesses: Less accurate during transitional periods
Q3: What specific metrics are driving the 2026 timeline?
A: Three key metrics align for 2026:
- Miner Revenue Cycle: Typically 24 months from halving to maximum stress
- Holder Duration Analysis: Long-term holders historically accumulate for 24-30 months post-halving
- Macro Cycle Alignment: Interest rate cycles typically last 24-36 months
Q4: Should I sell all my Bitcoin now and buy back at $56,000?
A: Market timing is extremely difficult. Consider:
- Tax Implications: Capital gains could be substantial
- Execution Risk: Might miss the bottom or sell at a loss
- Opportunity Cost: Could miss unexpected rallies
- Recommended Approach: Hold core position (50-70%), trade with margin (10-20%), keep cash reserve (20-30%)
Q5: How does this affect altcoins and the broader crypto market?
A: Historically:
- Bitcoin Dominance: Rises during bear markets (safety flight)
- Altcoin Drawdowns: Typically 70-90% from peaks
- Recovery Order: Bitcoin bottoms first, then major alts (ETH, SOL), then small caps
- Current Outlook: Expect altcoin/BTC pairs to weaken further until Bitcoin stabilizes
Q6: What signs should I watch for to confirm the bottom is in?
A: Look for confluence of multiple indicators:
- Price Action: 4+ months of consolidation above support
- On-Chain: MVRV Z-Score between -0.5 and -1.5
- Sentiment: Fear & Greed Index below 10 for extended period
- Fundamentals: Hash rate growing despite price decline
- Macro: Fed cutting rates or pausing QT
Q7: How do miner dynamics affect the 2026 bottom prediction?
A: Miners are crucial to the thesis:
- Current Status: Profit margins ~40% at $65,000 Bitcoin
- Capitulation Threshold: ~$45,000 for highest-cost producers
- Hash Rate Impact: Expected to decline 20-30% during bear market
- Historical Pattern: Miner capitulation -> reduced selling pressure -> price bottom
Q8: What’s the worst-case scenario if CryptoQuant is wrong?
A: Two primary risks:
- Too Optimistic: Bottom could be lower ($40,000-50,000) if severe recession hits
- Too Pessimistic: Bottom could be higher ($65,000-70,000) if ETFs attract unexpected inflows
- Probability Distribution:
- 30%: $56,000-60,000 (base case)
- 25%: $50,000-56,000 (bear case)
- 25%: $60,000-65,000 (bull case)
- 20%: Outside these ranges (black swan)
Q9: How should retirement accounts (401k, IRA) handle this prediction?
A: Conservative approach recommended:
- Reduce Allocation: From 5% to 2-3% of portfolio
- Switch Vehicles: From volatile single assets to diversified crypto ETFs
- Time Horizon: If retirement >10 years, consider maintaining position
- Rebalance Schedule: Quarterly instead of annually during volatility
Q10: What long-term opportunities emerge from a 2026 bottom?
A: Bear markets create generational opportunities:
- Entry Points: Best prices for long-term accumulation
- Project Survival: Strongest projects survive (invest in those)
- Infrastructure Builders: Companies building during bear markets often lead next cycle
- Regulatory Clarity: Often emerges during downturns
- Innovation Focus: Less speculation, more technological development
Strategic Recommendations for Different Investor Profiles
Conservative Investors (Low Risk Tolerance):
- Current Action: Reduce Bitcoin exposure to 1-2% of portfolio
- Accumulation Plan: Begin DCA at $58,000 with 1% monthly additions
- Time Horizon: 5+ year hold through next bull cycle
- Vehicle Preference: Regulated ETFs over direct ownership
Moderate Investors (Balanced Approach):
- Core Position: Maintain 3-5% allocation through decline
- Trading Sleeve: 1-2% for tactical entries at support levels
- Rebalancing: Trim winners, add to losers during volatility
- Diversification: 50% Bitcoin, 30% Ethereum, 20% blue-chip alts
Aggressive Investors (High Risk Tolerance):
- Maximum Drawdown Preparation: Position for 40-50% decline
- Leverage Avoidance: No margin during anticipated volatility
- Option Strategies: Protective puts at $60,000, call spreads for 2025-2026
- Altcoin Focus: Accumulate strongest projects during capitulation
Conclusion: Preparing for the Long Winter
CryptoQuant’s warning of a 2026 bottom at $56,000-$60,000 represents a sobering counter-narrative to the post-ETF euphoria that dominated early 2024. While predictions are inherently uncertain, their data-driven approach deserves serious consideration.
The coming 24 months may test investor patience but will likely separate long-term believers from short-term speculators. For those with multi-year time horizons, this period could offer the last opportunity to accumulate Bitcoin below $70,000 before the next major bull cycle begins in late 2026.
Remember: Bitcoin has survived 14 major drawdowns of 30% or more throughout its history. Each time, it emerged stronger with higher lows. Whether the bottom arrives at $56,000, $60,000, or elsewhere, the fundamental thesis of digital scarcity remains intact.
As legendary investor Howard Marks advises: “The biggest investing errors come not from factors that are informational or analytical, but from those that are psychological.” The ability to maintain perspective during periods of maximum pessimism often defines long-term success.
Final Takeaway: Plan for CryptoQuant’s scenario, hope for better, prepare for worse, and maintain the discipline that has characterized successful Bitcoin investment since its inception.
Disclaimer: This analysis is for informational purposes only and not investment advice. CryptoQuant’s predictions are one of many possible outcomes. Always conduct your own research, consider your risk tolerance, and consult with a financial advisor before making investment decisions. Past performance does not guarantee future results.
Related Analysis: