
Gold Price Prediction 2026, 2027, 2028-2030: Forecast, Targets & Outlook
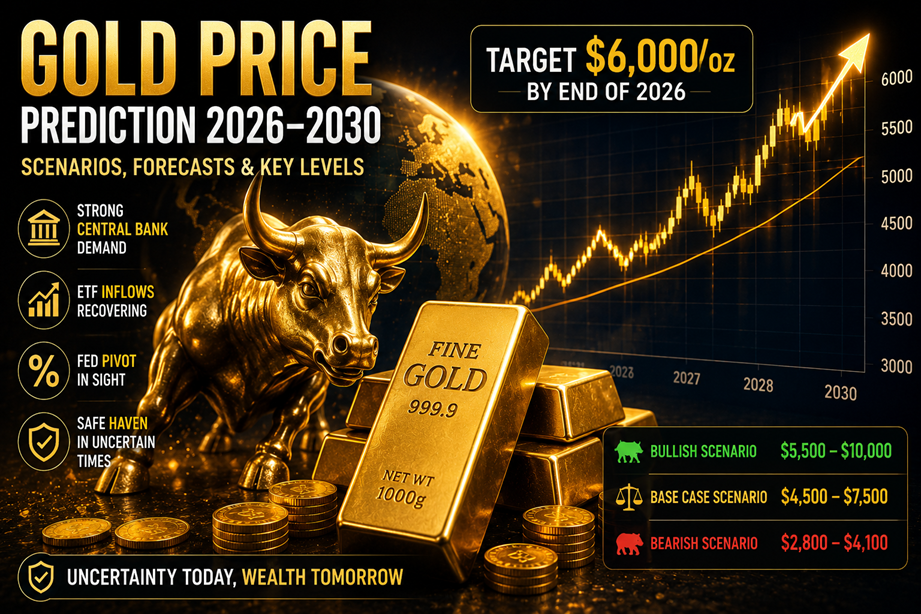
Gold Price Prediction 2026-2030: Forecast, Scenarios & Key Levels
Gold Price Prediction 2026-2030 | Latest Update
Gold has entered the second half of 2026 in a highly volatile but structurally interesting position. After reaching a record high early in the year, the metal experienced a significant correction before finding support near $4,170 per ounce and beginning another recovery.
J.P. Morgan’s latest published research describes gold as being in a technical “no-man’s land,” trading above its 200-day moving average near $4,340 while remaining below the 50-day moving average around $4,730. Its current research nevertheless sees potential for gold to reach $6,000/oz by Q4 2026 and approximately $6,300/oz in 2027, provided macroeconomic and policy conditions cooperate.
Recent market action has also been supportive. Gold futures reached around $4,409/oz on August 12, while reports from August showed the metal trading around the $4,400 area after a strong recovery.
So, what happens next?
Our scenario-based outlook suggests that gold could remain volatile in the short term while retaining a bullish longer-term structure. The biggest variables are Federal Reserve policy, real interest rates, the U.S. dollar, central-bank buying, ETF demand and geopolitical risk.
Important: Long-term gold forecasts are scenarios, not guaranteed price targets. The further into the future the forecast extends, the greater the uncertainty.
Gold Price Prediction: Quick Overview
| Time Horizon | Bearish Scenario | Base Case | Bullish Scenario |
|---|---|---|---|
| 7 days | $4,200-$4,350 | $4,350-$4,600 | $4,550-$4,750 |
| 30 days | $4,150-$4,350 | $4,400-$4,650 | $4,600-$4,900 |
| End of 2026 | $3,800-$4,100 | $4,500-$5,200 | $5,500-$6,000 |
| 2027 | $3,500-$3,900 | $5,000-$5,800 | $6,000-$7,000 |
| 2028 | $3,200-$3,800 | $5,500-$6,500 | $7,000-$8,500 |
| 2030 | $2,800-$3,500 | $6,000-$7,500 | $8,000-$10,000 |
Base-case view: Gold remains supported over the medium and long term, but could experience significant corrections before reaching higher levels.
Bull-case confirmation: A sustained breakout through the $4,730–$5,000 area would strengthen the bullish scenario.
Bear-case confirmation: A decisive break below approximately $4,170–$4,340 would weaken the current structure.
Gold Market Snapshot: August 2026
The current gold market can be summarized as a battle between strong structural demand and restrictive macroeconomic conditions.
| Market Factor | Current Situation | Potential Impact on Gold |
|---|---|---|
| Gold price | Around the $4,400 area in mid-August | Neutral/Bullish |
| 200-day MA | Around $4,340 | Important support |
| 50-day MA | Around $4,730 | Major resistance |
| 2026 low | Around $4,170 | Major downside reference |
| Central-bank demand | Structurally strong | 🟢 Bullish |
| ETF demand | Showing signs of recovery | 🟢 Potentially bullish |
| U.S. dollar | Important macro variable | 🟠 Mixed |
| Real yields | Still important headwind | 🔴 Potentially bearish |
| Fed policy | Major uncertainty | 🟠 High impact |
| Geopolitical risk | Elevated | 🟢 Safe-haven support |
| Investor positioning | Recovering after correction | 🟢/🟠 Mixed |
J.P. Morgan identifies the 200-day and 50-day moving averages as particularly important technical reference points, while the World Gold Council continues to report strong strategic interest in gold from central banks.
Gold Technical Analysis
Gold’s recent price action is best understood as a recovery within a wider consolidation range.
The metal initially surged to record levels in January before correcting sharply. The World Gold Council reported a January 2026 historical high of approximately $5,405/oz, followed by a notable correction during Q1.
Gold subsequently found an intra-year floor around $4,170, according to J.P. Morgan, and has since recovered toward the $4,400 area.
Key technical levels
| Level | Importance | What It Means |
|---|---|---|
| $5,000 | Psychological resistance | Major bullish confirmation |
| $4,730 | 50-day MA | Key resistance |
| $4,600 | Near-term resistance | Breakout continuation area |
| $4,400 | Current trading zone | Market pivot |
| $4,340 | 200-day MA | Important support |
| $4,170 | Major recent low | Bearish line in the sand |
| $4,000 | Psychological support | Major downside target |
The most important near-term question is whether gold can move decisively above the $4,730 region. A sustained breakout would suggest that the recent recovery is developing into a larger uptrend.
What Is Driving Gold Prices in 2026?
Gold is not controlled by one variable.
Several forces are interacting simultaneously.
1. Federal Reserve Policy
The Federal Reserve remains one of the biggest short-term drivers.
When markets expect lower interest rates, gold can benefit because falling yields reduce the opportunity cost of holding a non-yielding asset.
Conversely, expectations for higher-for-longer rates can strengthen the dollar and Treasury yields, potentially creating pressure on gold.
J.P. Morgan specifically identifies Fed policy as a major uncertainty surrounding its bullish gold outlook. Its research says the $6,000 year-end target is increasingly conditional on the path of rates.
Gold implication
| Fed Environment | Likely Gold Effect |
|---|---|
| Rate cuts | 🟢 Bullish |
| Dovish guidance | 🟢 Bullish |
| Rates unchanged | 🟡 Neutral |
| Higher-for-longer | 🔴 Bearish |
| Unexpected rate hikes | 🔴 Strongly bearish |
2. Real Interest Rates
Real yields are another important variable.
A simplified way to think about real yield is:
Real yield ≈ Nominal yield – Inflation expectations
When real yields rise, gold can become less attractive relative to interest-bearing assets.
When real yields fall, the opportunity cost of owning gold decreases.
Therefore:
Falling real yields → generally supportive for gold
Rising real yields → generally negative for gold
This relationship is not perfect, but it is one of the most important macro signals to monitor.
3. U.S. Dollar
Gold is priced internationally in U.S. dollars.
A weaker dollar generally makes gold more attractive to non-dollar investors.
A stronger dollar can create a headwind.
J.P. Morgan notes that gold has often exhibited a negative relationship with the dollar, although the relationship is not consistent in every market environment.
Simple framework
USD ↓ → Gold tends to benefit
USD ↑ → Gold may face pressure
This is why DXY should be monitored alongside gold rather than looking at XAU/USD in isolation.
4. Central-Bank Gold Buying
Central-bank demand has become one of gold’s most important structural supports.
The World Gold Council’s 2026 Central Bank Gold Reserves Survey found that:
- 89% of reserve managers expect global central-bank gold holdings to increase over the next 12 months.
- 45% expect their own gold holdings to increase.
- 83% believe gold will represent a higher share of reserves five years from now.
The World Gold Council also reported approximately 244 tonnes of central-bank net purchases in Q1 2026, up 3% year over year.
This creates an important long-term demand floor.
Why it matters
Central banks are generally longer-term participants.
Unlike short-term traders, they are often purchasing gold for:
- Reserve diversification
- Geopolitical risk management
- Protection against currency risk
- Long-term wealth preservation
That makes central-bank demand particularly important for a multi-year gold forecast.
5. Gold ETF Demand
ETF flows are another key indicator of investment demand.
Gold-backed ETFs experienced renewed interest in July, with global funds attracting approximately $3 billion and holdings increasing by about 23 tonnes, according to reporting citing World Gold Council data.
If ETF inflows continue, they could provide another source of demand for gold.
Conversely, sustained ETF outflows would weaken the bullish case.
6. Geopolitical Risk
Gold remains one of the world’s best-known safe-haven assets.
Trade disputes, military conflicts, sanctions and concerns about global financial stability can all increase demand for gold.
The World Gold Council’s 2026 outlook says geopolitical factors are expected to remain central to gold demand, supporting investment demand and central-bank buying.
However, geopolitical risk can work in both directions.
A sudden resolution of a major crisis could remove some safe-haven premium.
Gold Price Scenario Analysis
Rather than giving readers one supposedly precise gold price, it is more useful to model three possible paths.
Bearish Gold Price Scenario
Estimated probability: 25%
The bearish case becomes more credible if monetary policy turns significantly more restrictive.
Assumptions
- Inflation accelerates.
- U.S. employment remains strong.
- The Federal Reserve keeps rates high or resumes tightening.
- Real yields rise.
- The U.S. dollar strengthens substantially.
- Gold ETF outflows return.
- Central-bank buying slows.
- Geopolitical tensions ease.
Technical trigger
The first major warning would be a sustained break below the 200-day moving average near $4,340.
A move below the recent $4,170 floor would be considerably more bearish.
Potential price range
| Period | Bearish Scenario |
|---|---|
| Short term | $4,200-$4,350 |
| End 2026 | $3,800-$4,100 |
| 2027 | $3,500-$3,900 |
| 2028 | $3,200-$3,800 |
| 2030 | $2,800-$3,500 |
These are scenario ranges, not predictions that gold will necessarily reach these levels.
What could invalidate the bear case?
- Sudden geopolitical escalation
- Rapid Fed dovish shift
- Falling real yields
- Renewed ETF buying
- Gold reclaiming major resistance
Base-Case Gold Price Scenario
Estimated probability: 55%
The base case assumes that gold remains supported but does not immediately enter another explosive rally.
Assumptions
- The Fed avoids an aggressive hiking cycle.
- Inflation remains elevated but manageable.
- The dollar moves sideways or gradually weakens.
- Central-bank demand remains healthy.
- ETF flows stabilize or improve.
- Geopolitical uncertainty remains elevated.
- Gold holds its long-term support structure.
The World Gold Council’s latest research supports the view that central-bank demand and investment demand can remain important sources of support in 2026.
Potential price range
| Period | Base-Case Range |
|---|---|
| 7–30 days | $4,350–$4,650 |
| End 2026 | $4,500–$5,200 |
| 2027 | $5,000–$5,800 |
| 2028 | $5,500–$6,500 |
| 2030 | $6,000–$7,500 |
The base case is deliberately less aggressive than J.P. Morgan’s current year-end target. J.P. Morgan currently sees a path toward $6,000/oz in Q4 2026 and approximately $6,300/oz in 2027, but stresses that the outlook depends heavily on rates and geopolitical developments.
Base-case invalidation
The scenario becomes weaker if:
Gold < $4,170
or significantly stronger if:
Gold > $5,000
Bullish Gold Price Scenario
Estimated probability: 20%
The bullish scenario assumes that the macroeconomic environment becomes substantially more favorable for precious metals.
Assumptions
- The Fed shifts toward rate cuts.
- Real yields decline.
- The U.S. dollar weakens.
- Central-bank purchases remain strong or accelerate.
- Gold ETF inflows increase.
- Geopolitical risk remains elevated.
- Investors increase allocations to gold.
- Concerns about fiscal sustainability increase.
Key technical trigger
A sustained move above:
$4,730 → $5,000
would be a major bullish signal.
A breakout accompanied by strong investment flows could open the way toward higher levels.
Potential price range
| Period | Bullish Scenario |
|---|---|
| Short term | $4,600–$4,800 |
| End 2026 | $5,500–$6,000+ |
| 2027 | $6,000–$7,000 |
| 2028 | $7,000–$8,500 |
| 2030 | $8,000–$10,000 |
The $6,000 year-end 2026 level is particularly noteworthy because it is also J.P. Morgan Global Research’s current published forecast.
Bull-case risks
The bullish scenario could fail if:
- Inflation remains too high.
- Real yields rise.
- The dollar strengthens.
- ETF investors sell.
- Geopolitical tensions decline rapidly.
- Gold becomes excessively crowded.
Gold Price Forecast 2026-2030
Here is the complete scenario map:
| Year | Bear Case | Base Case | Bull Case |
|---|---|---|---|
| 2026 | $3,800–$4,100 | $4,500–$5,200 | $5,500–$6,000 |
| 2027 | $3,500–$3,900 | $5,000–$5,800 | $6,000–$7,000 |
| 2028 | $3,200–$3,800 | $5,500–$6,500 | $7,000–$8,500 |
| 2030 | $2,800–$3,500 | $6,000–$7,500 | $8,000–$10,000 |
Important interpretation
These ranges should not be interpreted as three equally likely forecasts.
They represent different macroeconomic environments.
The longer the time horizon, the wider the uncertainty becomes.
What Could Push Gold to $6,000?
A $6,000 gold price may look extreme compared with historical prices, but it is not impossible under the bullish conditions currently being discussed by major institutions.
J.P. Morgan Global Research currently forecasts approximately $6,000/oz in Q4 2026 and around $6,300/oz for 2027.
For gold to reach that area, several factors could align:
- Fed easing
- Lower real yields
- Weaker dollar
- Continued central-bank accumulation
- Strong ETF inflows
- Persistent geopolitical risk
- Higher inflation expectations
- Greater investor allocation to gold
It does not necessarily require every factor to occur simultaneously, but the more of these forces align, the stronger the bullish case becomes.
What Could Send Gold Below $4,000?
The opposite scenario is also important.
Gold could fall below $4,000 if:
- The Fed becomes unexpectedly hawkish.
- Inflation remains high while rates rise.
- Real yields increase substantially.
- The dollar strengthens.
- Central-bank buying declines.
- ETF investors sell aggressively.
- Geopolitical tensions ease.
- Investors rotate heavily toward risk assets.
A break below $4,170 would be an important technical warning.
A move below $4,000 would signal that the current medium-term bullish structure has suffered a much deeper breakdown.
Gold Price Prediction by Time Horizon
Next 7 Days
Expected range:
$4,200–$4,750
The key battle is around the $4,400–$4,730 region.
A breakout could produce momentum toward $4,750 and beyond.
A rejection could send gold back toward $4,300–$4,340.
Next 30 Days
Base-case range:
$4,400–$4,650
The market could remain rangebound while traders wait for clearer signals from:
- Federal Reserve policy
- Inflation
- Employment
- Treasury yields
- Dollar
- Geopolitical developments
End of 2026
Our scenario range is:
Bear:
$3,800–$4,100
Base:
$4,500–$5,200
Bull:
$5,500–$6,000+
The bullish end of this range is supported by J.P. Morgan’s current $6,000/oz Q4 forecast.
Gold Price Prediction 2027
J.P. Morgan’s latest published research currently points toward approximately $6,300/oz by the end of 2027.
Our broader scenario range is:
| 2027 Scenario | Forecast |
|---|---|
| Bearish | $3,500–$3,900 |
| Base | $5,000–$5,800 |
| Bullish | $6,000–$7,000 |
A sustained move toward $6,000+ would likely require continued investment demand, strong central-bank accumulation and a supportive monetary environment.
Gold Price Prediction 2028
The further we move into 2028, the less reliable precise numerical forecasts become.
Our scenario framework:
| Scenario | 2028 Gold Price |
|---|---|
| Bearish | $3,200-$3,800 |
| Base | $5,500-$6,500 |
| Bullish | $7,000-$8,500 |
Rather than focusing exclusively on the number, investors should monitor the underlying drivers.
If central banks continue increasing their strategic allocation to gold and global investors maintain strong demand, the long-term bullish scenario becomes more plausible.
Gold Price Prediction 2030
2030 forecasts should be treated as long-range scenarios, not precise predictions.
| Scenario | 2030 Range |
|---|---|
| Bearish | $2,800-$3,500 |
| Base | $6,000-$7,500 |
| Bullish | $8,000-$10,000 |
The bullish range would require a fundamentally different monetary and reserve environment from today’s market.
Potential drivers include:
- Persistent currency debasement
- Higher fiscal deficits
- Continued reserve diversification
- Strong central-bank gold accumulation
- Structural inflation concerns
- Geopolitical fragmentation
Gold vs. Bitcoin: Does Crypto Matter?
Gold and Bitcoin are different assets, but they increasingly compete for part of the same narrative: alternative stores of value outside traditional fiat-based assets.
Bitcoin’s market behavior can therefore influence the broader “digital gold” narrative.
However, gold has a much longer history as a reserve asset, and central banks directly hold physical gold as part of their reserves.
The World Gold Council’s 2026 survey shows that central banks continue to view gold as an important strategic reserve asset.
Therefore, Bitcoin’s performance should not be treated as a direct predictor of gold.
The 5 Most Important Gold Indicators to Watch
If you want to follow gold’s next major move, focus on these five indicators.
| Indicator | Bullish for Gold | Bearish for Gold |
|---|---|---|
| Fed policy | Dovish | Hawkish |
| Real yields | Falling | Rising |
| DXY | Falling | Rising |
| ETF flows | Inflows | Outflows |
| Central-bank demand | Increasing | Declining |
Add one more:
Geopolitical risk
A major geopolitical shock can temporarily override several other market signals.
Current Data vs. Forecast Assumptions
One of the most important aspects of a credible gold forecast is separating facts from assumptions.
| Category | What We Know | What We Are Assuming |
|---|---|---|
| Gold price | Around $4,400 in mid-August | — |
| Recent low | Around $4,170 | — |
| 200-day MA | Around $4,340 | — |
| 50-day MA | Around $4,730 | — |
| Fed policy | Major uncertainty | Future path uncertain |
| Central banks | Strong strategic demand | Continued demand |
| ETF flows | Showing recovery | Sustained inflows possible |
| Geopolitics | Elevated uncertainty | Future conflicts unknown |
| Inflation | Still important | Future inflation uncertain |
| 2027–2030 prices | — | Scenario estimates |
This distinction is important because a forecast is only as reliable as its assumptions.
Gold Forecast: What Could Change the Outlook?
The current forecast should be updated if any of the following happens:
Bullish changes
- Fed signals faster rate cuts
- Real yields decline
- DXY breaks lower
- ETF inflows accelerate
- Central-bank buying increases
- Gold breaks above $4,730
- Gold establishes itself above $5,000
Bearish changes
- Fed signals new rate hikes
- Real yields rise sharply
- DXY strengthens
- ETF outflows accelerate
- Central-bank buying slows significantly
- Gold falls below $4,340
- Gold breaks below $4,170
Final Gold Price Prediction
The gold market in August 2026 is at an important crossroads.
The short-term technical structure is mixed: gold has recovered from its $4,170 area, but it remains below the $4,730 50-day moving average while trading around the $4,400 area. J.P. Morgan describes this as a technical consolidation but maintains a much more bullish longer-term outlook.
At the same time, structural demand remains significant.
The World Gold Council’s 2026 research shows continued central-bank interest, with 45% of surveyed reserve managers expecting to increase their own gold holdings over the following 12 months.
That creates an interesting setup:
Short term:
Neutral to moderately bullish
Medium term:
Bullish if $4,730–$5,000 breaks
Long term:
Structurally bullish, but highly dependent on monetary policy and global demand
Our base-case scenario remains:
Gold could trade around $4,500-$5,200 by the end of 2026, with a bullish path toward $5,500-$6,000 if the Fed turns more accommodative and investment demand accelerates.
J.P. Morgan’s current published forecast is more bullish, targeting approximately $6,000/oz by Q4 2026 and $6,300/oz by 2027.
The most important levels to remember are:
$4,170 – major support
$4,340 – 200-day MA
$4,730 – major resistance
$5,000 – psychological breakout level
$6,000 – major bullish long-term target
Ultimately, gold’s next major trend will likely be determined less by the gold chart alone and more by the interaction between Federal Reserve policy, real yields, the U.S. dollar, central-bank demand, ETF flows and geopolitical risk.
Gold Price Prediction: Frequently Asked Questions
Will gold go up in 2026?
The longer-term outlook remains constructive, although gold could experience substantial corrections. J.P. Morgan currently expects gold to reach around $6,000/oz by Q4 2026.
What is the gold price prediction for 2027?
Our base-case range is approximately $5,000-$5,800, while the bullish scenario reaches $6,000-$7,000. J.P. Morgan’s current forecast is around $6,300/oz for 2027.
Can gold reach $6,000 in 2026?
Yes, it is a plausible bullish scenario. J.P. Morgan Global Research currently forecasts approximately $6,000/oz in Q4 2026.
What is the most important gold support level?
The $4,340 area, corresponding approximately to the 200-day moving average identified by J.P. Morgan, is an important technical reference. The previous $4,170 low is a deeper support level.
What is the biggest resistance for gold?
The $4,730 area, corresponding approximately to the 50-day moving average, is an important near-term resistance zone. A sustained move above $5,000 would provide stronger bullish confirmation.
Is gold bullish or bearish in 2026?
The answer depends on the timeframe. Short-term, gold is consolidating; medium- and long-term, the structural outlook remains bullish, supported by central-bank demand, geopolitical uncertainty and investment demand.
What could make gold fall?
A stronger U.S. dollar, higher real yields, unexpectedly hawkish Federal Reserve policy, falling ETF demand and reduced geopolitical risk could all pressure gold.