
Crypto Market Outlook September 24, 2026: BTC, ETH & SOL
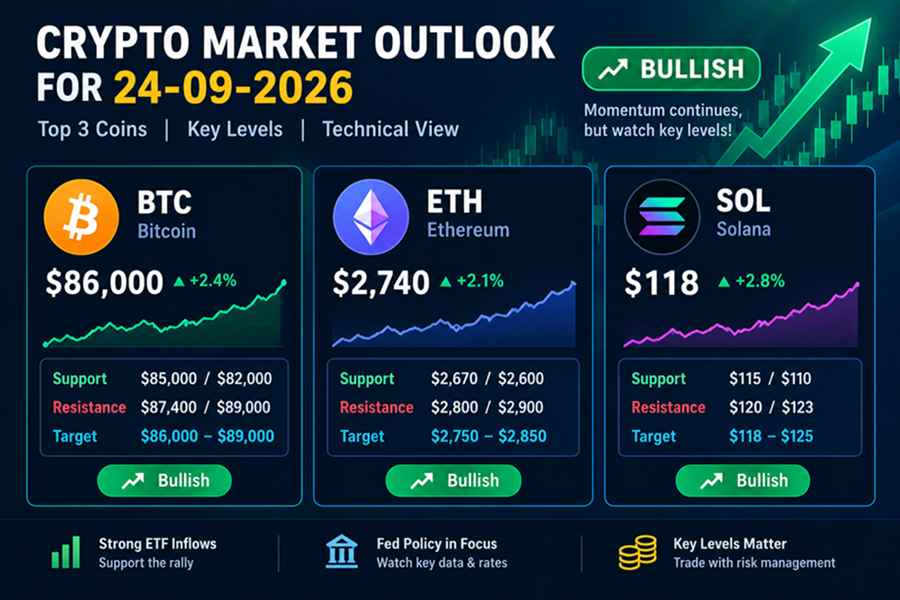
Crypto Market Outlook for September 24, 2026: Top 3 Coins, Targets & Technical Analysis
Market Outlook Date: September 24, 2026
Top Coins: Bitcoin (BTC), Ethereum (ETH), Solana (SOL)
Overall Market Bias: Bullish, but short-term consolidation risk is high
Market Condition: Strong momentum + elevated volatility
The cryptocurrency market enters September 24, 2026 in a completely different position from the middle of the month.
Bitcoin has recovered sharply from the September lows and is now trading around $86,000, Ethereum is around $2,730–$2,750, while Solana has climbed toward $118–$120.
The most important development is that the market has absorbed several major negative catalysts—including the Federal Reserve’s September rate hike—and crypto prices have nevertheless pushed higher.
The Federal Reserve raised its target rate by 25 basis points on September 16 to 3.75%–4.00%. The Fed said inflation remained elevated, but economic activity was expanding at a solid pace.
Since then, Bitcoin has broken above the $85,000 area and briefly reached approximately $87,400, while strong ETF demand has provided an additional source of buying pressure.
The market is therefore entering September 24 with a very important question:
Can Bitcoin turn the $85,000 area into sustainable support and make another attempt at $90,000?
My answer is that the technical structure remains constructive, but traders should expect consolidation after such a fast rally.
September 24, 2026 – Top 3 Crypto Market Prediction
| Rank | Coin | Current Zone | Key Support | Key Resistance | Sept. 24 Target | Bias |
|---|---|---|---|---|---|---|
| 🥇 1 | Bitcoin (BTC) | ~$86K | $85K / $82K | $87.4K / $89K | $86K–$89K | Bullish |
| 🥈 2 | Ethereum (ETH) | ~$2.74K | $2,670 / $2,600 | $2,800 / $2,900 | $2,750–$2,850 | Bullish |
| 🥉 3 | Solana (SOL) | ~$118 | $115 / $110 | $120 / $123 | $118–$125 | Bullish |
Overall market view
BTC: Bullish above $85,000
ETH: Bullish above $2,670
SOL: Bullish above $115
The biggest short-term risk is not necessarily a trend reversal. It is profit-taking after a rapid multi-day rally.
1. Bitcoin Price Prediction for September 24, 2026
BTC Outlook: Bullish Above $85,000
Bitcoin is the most important chart for September 24.
BTC has moved from approximately $80,000 to above $87,000 within a few sessions. On September 23, Bitcoin was trading around $86,000 after briefly reaching approximately $87,395.
This is a major technical improvement compared with the September 12 setup.
The $85,000 area has now become the immediate test for buyers.
Recent technical analysis identifies:
- $85,000 as immediate support
- approximately $87,300–$87,400 as short-term resistance
- $89,000 as the next major resistance
- $82,281 as an important structural support level
A technical report also showed Bitcoin trading above its 20-, 50- and 200-day exponential moving averages, although RSI was above 70, indicating that short-term momentum is becoming stretched.
BTC Technical Levels
| BTC Level | Importance |
|---|---|
| $92,000–$95,000 | Extended bullish target |
| $89,000–$90,000 | Major resistance / psychological zone |
| $87,300–$87,400 | Immediate breakout resistance |
| $85,000–$86,000 | Current decision zone |
| $82,000–$82,300 | Major structural support |
| $80,000–$81,000 | Secondary support |
| $77,000–$78,000 | Major downside support |
BTC Bullish Scenario
If Bitcoin remains above $85,000 and breaks the recent high around $87,400:
$87,500 → $89,000 → $90,000
A confirmed daily breakout above $90,000 could potentially put:
$92,000 → $95,000
into focus.
However, the $90,000 level should be treated as a major psychological and technical test rather than assuming it will break immediately.
BTC Base Scenario
Bitcoin consolidates between:
$84,500–$89,000
This would actually be a healthy development after the rapid rally.
A sideways period could allow momentum indicators to cool while buyers continue defending the breakout.
BTC Bearish Scenario
The bullish setup becomes weaker if BTC falls below $85,000.
Potential downside levels:
$83,000 → $82,300 → $80,000
A sustained move below $82,000 would be a much more important warning signal.
My BTC Prediction for September 24
Base range: $85,000–$89,000
Bullish target: $89,000–$92,000
Extended target: $95,000
Bearish risk: $82,000–$84,000
Key level: $85,000
Market bias: Bullish
2. Ethereum Price Prediction for September 24, 2026
ETH Outlook: Bullish Above $2,670
Ethereum has also experienced a strong recovery.
ETH was around $2,739 on September 23, after reaching a recent high around $2,805 on September 21.
The strongest recent catalyst has been institutional demand.
On September 21, U.S. spot Ether ETFs reportedly received approximately $270 million, their largest single-day inflow of 2026. The following day, Ether ETFs added another approximately $162.2 million.
That is an important change from the weaker ETF-flow environment seen earlier in September.
ETH Technical Levels
| ETH Level | Importance |
|---|---|
| $3,000 | Major psychological target |
| $2,900–$2,950 | Extended resistance |
| $2,800 | Immediate major resistance |
| $2,750 | Current pivot |
| $2,670 | Key support |
| $2,600–$2,650 | Secondary support |
| $2,500 | Major structural support |
Recent technical analysis has identified approximately $2,800 as the ceiling, with $2,667 around an important support area.
ETH Bullish Scenario
If ETH holds above $2,670 and breaks $2,800:
$2,800 → $2,850 → $2,900
A strong breakout could then bring:
$2,950 → $3,000
into focus.
The psychological importance of $3,000 makes it a natural area for profit-taking.
ETH Base Scenario
ETH consolidates between:
$2,670-$2,820
This would keep the broader bullish structure intact.
ETH Bearish Scenario
If ETH loses $2,670:
$2,600 → $2,550 → $2,500
could become the next support sequence.
A move below $2,500 would substantially weaken the short-term bullish setup.
My ETH Prediction for September 24
Base range: $2,700–$2,850
Bullish target: $2,850–$2,950
Extended target: $3,000
Bearish risk: $2,550–$2,650
Key level: $2,670
Market bias: Bullish
3. Solana Price Prediction for September 24, 2026
SOL Outlook: Bullish but Overheated Near $120
Solana has been one of the strongest movers in the recent recovery.
SOL closed around $118.46 on September 23, after reaching nearly $120 during the session. The cryptocurrency had moved from approximately $101.68 on September 17 to nearly $119 by September 21-23.
That represents a very rapid move.
Therefore, SOL has attractive upside potential, but it also has a higher probability of short-term profit-taking.
Recent technical data places approximately $123-$124 as an important resistance region.
SOL Technical Levels
| SOL Level | Importance |
|---|---|
| $135-$140 | Extended bullish target |
| $125 | Major breakout zone |
| $120-$123 | Immediate resistance |
| $115-$118 | Current decision area |
| $110-$112 | Key support |
| $105 | Secondary support |
| $100 | Major psychological support |
SOL Bullish Scenario
If SOL breaks above $120–$123 with strong volume:
$125 → $130 → $135
could become the next sequence.
A broader altcoin rally could potentially extend SOL toward:
$140+
SOL Base Scenario
SOL consolidates between:
$112–$123
after its rapid recovery.
This would not necessarily be bearish. A consolidation could allow the market to absorb recent gains.
SOL Bearish Scenario
If SOL loses $112:
$110 → $105 → $100
becomes the important downside sequence.
Because SOL has risen rapidly, a correction can be larger in percentage terms than BTC.
My SOL Prediction for September 24
Base range: $115-$123
Bullish target: $125-$135
Extended target: $140
Bearish risk: $105-$112
Key level: $115
Market bias: Bullish / High Volatility
Why Crypto Is Rising Despite the Fed Rate Hike
This is one of the most interesting features of the current market.
The Federal Reserve raised interest rates by 25 basis points on September 16, taking the federal funds target range to 3.75%–4.00%. The Fed also said inflation remained elevated.
Normally, higher interest rates can create pressure on risk assets.
But Bitcoin subsequently rallied strongly.
Why?
1. ETF Demand
U.S. spot Bitcoin ETFs attracted approximately $999 million on September 21, followed by another $714.7 million on September 22.
That is a major institutional demand signal.
2. Short Liquidations
Recent market analysis attributes part of the rally to a large short squeeze, with approximately $650 million of crypto shorts liquidated over a 24-hour period during the acceleration of the move.
Short sellers buying back positions can accelerate an existing rally.
3. Bitcoin Broke Above $85,000
The move above $85,000 changed the immediate technical structure.
Bitcoin is now substantially above the $77,000-$80,000 area that dominated the market earlier this month.
4. Institutional Interest Has Returned
The recent ETF inflows suggest that institutional demand is currently stronger than it was during the middle-of-September correction.
This does not guarantee continued upside, but it is an important factor supporting the current trend.
September 24 Crypto Market Scenarios
Bullish Scenario
The bullish scenario is triggered by BTC remaining above $85,000.
| Coin | Bullish Target |
|---|---|
| BTC | $89K-$92K |
| ETH | $2.85K-$3.00K |
| SOL | $125-$135 |
A Bitcoin breakout above $90,000 would significantly improve market momentum.
Base Scenario
The market pauses after its strong rally.
| Coin | Expected Range |
|---|---|
| BTC | $84.5K-$89K |
| ETH | $2.67K-$2.82K |
| SOL | $112-$123 |
This scenario would represent healthy consolidation rather than a confirmed reversal.
Bearish Scenario
The bearish scenario starts if Bitcoin loses $85,000 and the move becomes a broader risk-off correction.
| Coin | First Downside | Deeper Support |
|---|---|---|
| BTC | $82K-$84K | $80K-$81K |
| ETH | $2.55K-$2.67K | $2.50K |
| SOL | $105-$112 | $100 |
The most important confirmation would be a sustained BTC break below $82,000.
Top 3 Crypto Ranking for September 24, 2026
Bitcoin – Market Leader
Bitcoin remains the primary market indicator.
The strongest argument for BTC is the combination of:
- Break above $85,000
- Strong ETF inflows
- Institutional demand
- Positive short-term momentum
- Recovery despite the Fed hike
Key support: $85,000
Resistance: $87,400 / $89,000
Major target: $90,000+
Ethereum – Strong Institutional Recovery
Ethereum has developed an increasingly constructive setup.
The recent ETF inflows are particularly important, while ETH is approaching the $2,800 resistance area.
Key support: $2,670
Resistance: $2,800
Target: $2,850-$3,000
Solana – High-Performance, High-Volatility Setup
Solana has delivered a rapid recovery and is approaching $120.
The trend is strong, but traders should be aware that momentum indicators are becoming stretched.
Key support: $115
Resistance: $120-$123
Target: $125-$135
September 24, 2026 Crypto Market Outlook – Final View
The crypto market has undergone a significant change over the past week.
Bitcoin has recovered from the mid-$70,000s and pushed above $85,000.
Ethereum has recovered toward $2,750.
Solana has moved toward $120.
Most importantly, the market has absorbed the Federal Reserve’s September rate hike and subsequently attracted substantial ETF inflows.
Therefore, my September 24 market outlook is bullish, but with a strong warning about short-term overextension.
Bitcoin’s RSI was reported above 70, while ETH and SOL were also showing elevated momentum. That means a temporary pullback or sideways consolidation would not automatically invalidate the broader recovery.
My final September 24 targets
| Coin | Base Target | Bullish Target | Bearish Risk | Key Level | Outlook |
|---|---|---|---|---|---|
| BTC | $85K-$89K | $90K-$92K | $82K-$84K | $85K | Bullish |
| ETH | $2.70K-$2.85K | $2.90K-$3.00K | $2.55K-$2.67K | $2.67K | Bullish |
| SOL | $115-$123 | $125-$135 | $105-$112 | $115 | Bullish |
The Three Levels to Watch on September 24
Bitcoin: $85,000
Above $85K → bulls retain control.
Below $85K → consolidation becomes more likely.
Below $82K → short-term bullish structure becomes questionable.
Ethereum: $2,670
Above $2,670 → $2,800 remains in focus.
Above $2,800 → $2,900–$3,000 becomes possible.
Below $2,600 → momentum weakens.
Solana: $115
Above $115 → $120–$125 remains in focus.
Above $125 → $130–$135 becomes possible.
Below $110 → correction risk increases.
Frequently Asked Questions
What is the Bitcoin prediction for September 24, 2026?
The base-case Bitcoin range is approximately $85,000-$89,000. A breakout above $87,400 could put $89,000–$90,000 into focus, while $85,000 is the key immediate support.
Can Bitcoin reach $90,000?
A move toward $90,000 is technically possible if Bitcoin maintains the recent breakout and clears the $87,400–$89,000 resistance zone. A sustained break above $90,000 would be a more significant confirmation of the next upside leg.
What is the Ethereum prediction for September 24?
ETH could trade around $2,700-$2,850. The major level is $2,800. A breakout could open $2,900–$3,000, while $2,670 is the key support.
What is the Solana prediction for September 24?
SOL could trade around $115-$123. A breakout above $123 could target $125-$135, while losing $110 would increase correction risk.
Is crypto bullish on September 24, 2026?
The short-term structure is bullish, but the recent rally has been fast. BTC, ETH and SOL are all approaching technically important resistance zones, so consolidation or profit-taking is possible.
What is the biggest risk to the crypto market?
The biggest immediate risk is a sharp reversal after the recent rally. A decline below BTC’s $85,000 support, followed by a break below $82,000, would materially weaken the current setup.
Risk Management Note
The current market is moving quickly. Traders should avoid treating a price target as a guaranteed outcome.
The more useful approach is to monitor support, resistance, volume and confirmation.
For September 24, the key framework is:
BTC $85K → $87.4K → $89K
ETH $2.67K → $2.80K → $3K
SOL $115 → $123 → $135
These are scenario levels, not guaranteed prices.
Disclaimer
This September 24, 2026 cryptocurrency market outlook is for educational and informational purposes only. It represents a scenario-based analysis of market conditions and does not guarantee future prices or constitute financial advice.
Cryptocurrency markets are highly volatile. Prices can change rapidly because of ETF flows, liquidity, leverage, Federal Reserve policy, geopolitical events, regulation and unexpected news.
Always conduct your own research and use appropriate risk management before trading or investing.