
Top 3 Cryptocurrency Price Predictions & Market Analysis – Bitcoin, Ethereum and BNB Outlook (July 2026)
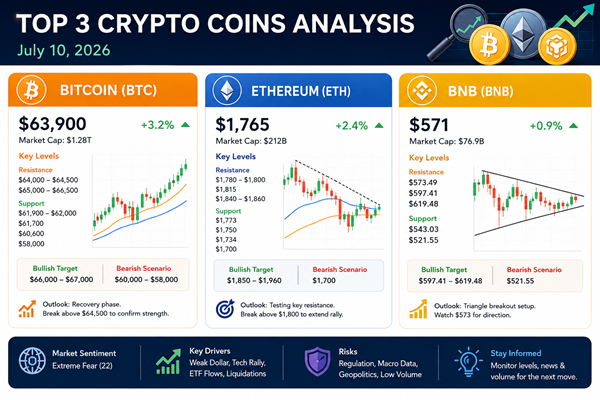
Top 3 Cryptocurrency Price Predictions & Market Analysis – Bitcoin (BTC), Ethereum (ETH) and BNB Outlook (July 2026)
Published: July 10, 2026
Cryptocurrency Market Overview: Recovery Rally or Beginning of a New Trend?
The cryptocurrency market is showing signs of recovery after a prolonged period of uncertainty, with major digital assets attempting to rebuild bullish momentum. As of July 10, 2026, Bitcoin (BTC), Ethereum (ETH), and BNB remain among the most closely watched cryptocurrencies by investors worldwide.
While the recent price recovery has improved market sentiment, analysts remain cautious about declaring the beginning of a new bull market. Current indicators suggest that the market may still be in a recovery phase following a major correction, rather than a confirmed long-term uptrend.
The latest rebound has been supported by several macroeconomic factors, including a weaker U.S. dollar, improved sentiment in global technology markets, artificial intelligence and semiconductor sector growth, and large-scale short liquidations in crypto markets.
However, investors should continue monitoring important factors such as ETF fund flows, trading volume, inflation data, regulatory developments, and long-term holder behavior before making major investment decisions.
This analysis covers the latest Bitcoin price prediction, Ethereum price forecast, and BNB market outlook, including technical analysis, support and resistance levels, bullish and bearish scenarios, and key factors influencing future price movements.
1. Bitcoin (BTC) Price Prediction & Market Analysis
Bitcoin Market Outlook
Bitcoin remains the leading cryptocurrency by market capitalization and continues to influence the overall direction of the digital asset market.
As of July 10, 2026, Bitcoin is trading around $63,900–$64,050, showing a daily increase of approximately 3%–3.5%. BTC recently recovered from lows near $61,850, reversing losses caused by geopolitical uncertainty and broader risk-off sentiment.
The latest recovery has been driven mainly by:
- Short-position liquidations accelerating upward momentum
- Weakening U.S. dollar conditions
- Strong performance in Asian technology and semiconductor stocks
- Renewed institutional interest in digital assets
However, the market remains cautious. The Crypto Fear & Greed Index is currently around 22–23, indicating Extreme Fear among investors.
Extreme fear often appears during market bottoms, but analysts believe Bitcoin still requires stronger confirmation before entering a sustained bullish cycle.
According to market analysts, Bitcoin may be approaching the later stages of a bear market recovery, but a confirmed reversal requires:
- Continued improvement in long-term holder confidence
- Stabilization of Bitcoin ETF flows
- Sustained price movement above key realized price levels
- Increased spot market demand
Bitcoin Technical Analysis
Current Bitcoin Price:
$63,900–$64,050
24-Hour Trading Range:
$61,600–$64,200
Market Capitalization:
Approximately $1.28 trillion
Performance:
- Year-to-date performance: Approximately -27%
- One-year performance: Approximately -40%
Bitcoin has recently completed a recovery pattern often described as:
Bottom Formation → Price Recovery → Potential Breakout Attempt
The asset has moved back above several important moving averages, improving short-term momentum.
Technical indicators show:
Moving Average Trend:
Bitcoin has reclaimed important short-term moving averages, suggesting improving buyer strength.
MACD Indicator:
The 4-hour MACD has produced a bullish crossover, indicating increasing short-term momentum.
RSI Indicator:
The Relative Strength Index has recovered toward the neutral 50 level, showing improving market balance between buyers and sellers.
Bitcoin Support and Resistance Levels
| Level | Price Zone | Market Importance |
|---|---|---|
| Immediate Support | $61,900–$62,000 | 50-day EMA support zone and current recovery base |
| Key Support | $61,700 | Recent daily low and important defense level |
| Critical Support | $60,600 | Loss of this level may weaken the recovery structure |
| Major Support | $58,000 | Long-term market support zone |
| Immediate Resistance | $64,000–$64,500 | Current breakout area |
| Major Resistance | $65,000–$66,500 | Previous high zone and moving average resistance |
Bitcoin Price Prediction Scenario
Bullish Scenario
If Bitcoin successfully breaks above $64,500 with strong trading volume, the next potential targets could be:
- $66,000
- $67,000
A breakout above this region would indicate stronger market confidence and could attract additional institutional buying.
Bearish Scenario
If Bitcoin fails to maintain support around $61,700, sellers may attempt another downward move toward:
- $60,000
- $58,000
A breakdown below $58,000 would significantly weaken the recovery outlook.
Why Bitcoin Could Continue Recovering
1. Improving Technical Structure
Bitcoin has successfully recovered from recent lows and is showing early signs of trend improvement.
2. Favorable Macro Environment
A weakening U.S. dollar and strength in technology markets have supported risk assets, including cryptocurrencies.
3. Institutional Sentiment Improvement
Institutional investors are increasingly focusing on strategic entry points and portfolio allocation rather than questioning cryptocurrency adoption.
This suggests improving long-term confidence in digital assets.
4. Market Caution Remains
Despite positive signals, trading volume remains below previous market peaks, and ETF flows require further improvement.
Many analysts consider the current movement a technical recovery rally rather than a confirmed bull market reversal.
2. Ethereum (ETH) Price Prediction & Market Analysis
Ethereum Market Outlook
Ethereum remains the second-largest cryptocurrency by market capitalization and continues to play a major role in decentralized finance, smart contracts, NFTs, and blockchain infrastructure.
As of July 10, 2026, Ethereum is trading around:
$1,747–$1,775
ETH has gained approximately 2%–2.6% in the last 24 hours, recovering from June lows near $1,500.
Ethereum is currently testing a major technical resistance zone that could determine its next major move.
The current recovery is supported by:
- Stronger buyer demand near lower levels
- Continued Ethereum ETF inflows
- Recovery above important moving averages
- Improving short-term momentum indicators
However, Ethereum still faces resistance from the broader market weakness and requires a confirmed breakout before entering a stronger bullish phase.
Ethereum Technical Analysis
Current Price:
$1,747–$1,775
Market Capitalization:
Approximately $211–$213 billion
Key Technical Zone:
$1,780–$1,800 resistance area
Ethereum has successfully moved above:
- 20-day moving average
- 50-day moving average
This indicates improving short-term momentum.
Technical indicators:
RSI:
Ethereum RSI remains above the neutral 50 level, suggesting improving buying pressure.
Bollinger Bands:
ETH is trading near the upper Bollinger Band, showing strength but also indicating possible short-term overextension.
Parabolic SAR:
The indicator remains below price, supporting the current short-term bullish trend.
Ethereum Support and Resistance Levels
| Level | Price Zone | Market Importance |
|---|---|---|
| Immediate Support | $1,773 | High-volume trading area |
| Secondary Support | $1,750 | Short-term downside protection |
| Key Support | $1,734 | Important buyer defense zone |
| Major Support | $1,700 | Psychological support level |
| Immediate Resistance | $1,780–$1,800 | Major breakout zone |
| Critical Resistance | $1,815 | Trendline resistance |
| Next Target | $1,840–$1,860 | Potential upside zone |
Ethereum Price Prediction Scenario
Bullish Scenario
A strong breakout above $1,800 with increasing volume could open the path toward:
- $1,850
- $1,900
- $1,960 (100-day EMA area)
Bearish Scenario
Failure to break above $1,800 may result in a pullback toward:
- $1,700 support zone
Ethereum Market Factors
Positive Factors:
- Stronger technical structure compared with previous recovery attempts
- Continued ETF demand
- Increasing investor confidence
- Improved momentum indicators
Risks:
- Lack of strong volume confirmation
- Overall market uncertainty
- Bitcoin price weakness could impact ETH performance
Ethereum currently appears to be in a technical recovery phase, but confirmation of a long-term bullish trend requires a decisive breakout.
3. BNB (Binance Coin) Price Prediction & Market Analysis
BNB Market Outlook
BNB (Binance Coin) remains one of the largest cryptocurrencies by market capitalization and plays a central role within the Binance ecosystem, including transaction fee discounts, decentralized applications, and BNB Chain infrastructure.
As of July 10, 2026, BNB is trading around:
$569–$574
The cryptocurrency has recorded a modest daily gain of approximately 0.6%–1.3%, with a market capitalization of nearly:
$76–$77 billion
Unlike Bitcoin and Ethereum, BNB is currently facing a more complex market environment. The price is approaching a critical technical decision point, with a symmetrical triangle pattern nearing completion.
This formation suggests that a significant price movement may occur soon, but the direction will depend on breakout confirmation and trading volume.
Currently, BNB is influenced by several competing factors:
Positive Factors:
- Continued growth of the BNB Chain ecosystem
- Strong liquidity and market participation
- Expansion into artificial intelligence and high-performance blockchain infrastructure
- Strong position among large-cap cryptocurrencies
Negative Factors:
- Declining trading volume
- Regulatory uncertainty surrounding Binance
- Price trading below major moving averages
BNB Technical Analysis
Current Price:
$569–$574
24-Hour Change:
+0.6% to +1.3%
Market Capitalization:
Approximately $76.9 billion
Current Technical Pattern:
Symmetrical Triangle Formation
BNB is approaching the apex of this pattern, indicating that volatility may increase significantly in the near term.
Technical indicators show:
Moving Average Analysis
BNB is currently trading below:
- 20-day EMA: $575.79
- 50-day EMA: $594.90
This indicates that although buyers are attempting a recovery, bullish momentum has not yet fully returned.
Bollinger Band Analysis
The Bollinger Bands are narrowing:
- Upper Band: $596.57
- Middle Band: $569.92
- Lower Band: $543.27
A narrowing Bollinger Band structure often signals a period of low volatility before a larger price movement.
BNB Support and Resistance Levels
| Level | Price Zone | Market Importance |
|---|---|---|
| Critical Support | $543.03 | Lower Bollinger Band and triangle support |
| Secondary Support | $521.55 | Next major downside protection |
| Immediate Resistance | $573.49 | Current breakout boundary |
| Breakout Target 1 | $597.41 | First bullish target after breakout |
| Breakout Target 2 | $619.48 | Next major resistance zone |
BNB Price Prediction Scenario
Bullish Scenario
If BNB breaks above:
$573.49
with strong volume confirmation, the next potential targets are:
- $597.41
- $619.48
A successful breakout would signal renewed buyer confidence and could push BNB toward higher resistance levels.
Bearish Scenario
If BNB loses the important support level of:
$543.03
the price may decline toward:
- $521.55
A failure around the $570 level could also end the short-term recovery attempt and create a possible retest of:
- $560
- $550
Why BNB Could Move Higher
1. Technical Breakout Setup
The symmetrical triangle pattern suggests that BNB is preparing for a larger directional move.
A breakout accompanied by increasing volume could create a strong bullish continuation.
2. BNB Chain Ecosystem Development
BNB Chain continues expanding its blockchain infrastructure, focusing on:
- Artificial intelligence applications
- High-frequency trading capabilities
- Faster transaction processing
- Developer ecosystem growth
Future upgrades and ecosystem expansion could improve long-term demand for BNB.
3. Strong Liquidity Position
Despite market uncertainty, BNB maintains strong liquidity and remains one of the most widely traded cryptocurrencies globally.
This provides a defensive advantage compared with smaller altcoins.
Risks Facing BNB
Regulatory Pressure
Regulatory developments remain a major factor affecting Binance and BNB.
Potential restrictions, compliance requirements, or changes in regional crypto regulations could impact investor sentiment.
Declining Trading Volume
One of the biggest concerns is reduced market participation.
A breakout without strong volume confirmation may become a false breakout.
Investors should monitor whether buying pressure increases during major price movements.
Cryptocurrency Market Risk Factors to Watch
Although Bitcoin, Ethereum, and BNB are showing recovery signals, several risks could influence the next market direction.
1. Global Economic Conditions
Cryptocurrency markets remain highly sensitive to macroeconomic factors, including:
- U.S. inflation data
- Federal Reserve interest rate decisions
- Dollar strength
- Global liquidity conditions
Upcoming economic reports could significantly impact risk assets.
2. ETF Market Activity
Bitcoin and Ethereum ETFs have become important indicators of institutional demand.
Positive ETF inflows may support long-term price recovery, while continued outflows could limit market momentum.
3. Geopolitical Uncertainty
Global conflicts and economic uncertainty can create short-term volatility.
Investors often reduce exposure to risky assets during periods of geopolitical stress.
4. Regulatory Developments
Cryptocurrency regulation continues to influence market confidence.
Important areas to monitor include:
- Exchange regulations
- Stablecoin policies
- Institutional crypto frameworks
- Regional compliance requirements
Frequently Asked Questions (FAQs)
1. Why are Bitcoin and Ethereum prices increasing today?
The recent cryptocurrency recovery is mainly driven by:
- A weaker U.S. dollar
- Improved global technology market sentiment
- Artificial intelligence and semiconductor sector strength
- Short-position liquidations in crypto markets
However, the current rally is still considered a recovery phase rather than a confirmed bull market.
2. Is the cryptocurrency bull market starting again?
Not yet.
Although Bitcoin, Ethereum, and other major cryptocurrencies are showing improvement, analysts are waiting for stronger confirmation signals.
A confirmed bull market would require:
- Sustained buying demand
- Positive ETF flows
- Strong trading volume
- Long-term holder confidence
- Breakouts above major resistance levels
3. What are the most important Bitcoin price levels?
Important Bitcoin levels:
Support:
- $61,700
- $60,600
- $58,000
Resistance:
- $64,500
- $66,000
- $67,000
A breakout above $64,500 could improve the bullish outlook.
4. What are Ethereum’s next price targets?
Ethereum’s key breakout level is:
$1,800
If ETH moves above this level with strong volume, possible targets include:
- $1,850
- $1,900
- $1,960
Failure to break resistance could send ETH back toward $1,700.
5. What does support and resistance mean in crypto trading?
Support
Support is a price level where buying demand becomes strong enough to prevent further decline.
It acts like a market “floor.”
Resistance
Resistance is a price level where selling pressure increases and prevents further price growth.
It acts like a market “ceiling.”
Breaking resistance or losing support often signals the beginning of a new market trend.
6. What is the Crypto Fear & Greed Index?
The Crypto Fear & Greed Index measures investor sentiment from:
0 = Extreme Fear
to
100 = Extreme Greed
A reading around 22 indicates extreme fear.
Historically, extreme fear has sometimes appeared near market bottoms because investors become overly pessimistic.
However, it does not guarantee an immediate price recovery.
Final Crypto Market Outlook – July 2026
The cryptocurrency market is currently experiencing a recovery phase after a significant correction.
Bitcoin (BTC)
Bitcoin shows improving technical momentum but must break above $64,500–$65,000 to confirm stronger bullish continuation.
Ethereum (ETH)
Ethereum is showing promising short-term strength, with $1,800 acting as the key breakout level.
BNB
BNB is approaching a major technical breakout point, but volume confirmation remains essential.
Overall, the market outlook is cautiously optimistic. Investors should watch technical levels, institutional activity, macroeconomic developments, and regulatory changes before making investment decisions.
The current environment represents a potential opportunity, but risk management remains critical because cryptocurrency markets continue to experience high volatility.
Disclaimer
This cryptocurrency market analysis is provided for educational and informational purposes only. It does not represent financial advice, investment recommendations, or trading signals.
Cryptocurrency prices are highly volatile, and investors should conduct their own research, evaluate their risk tolerance, and consult qualified financial professionals before making investment decisions.
Market conditions can change rapidly, and past performance does not guarantee future results.